Article 58
The limitations of valuation
Westminster Asset Management Investment Strategist Peter Lucas reviews various indicators that have historically been used to trade markets, with a focus on valuation. He concludes that perhaps this most talked about measure isn’t quite as useful as many imagine.
In previous posts I have talked about the limitations of valuation as a tactical trading tool, and that despite these limitations, it is the one thing that analysts always insist on talking about. Today I would like to expand on this thinking with reference to some historical performance statistics.
The table below shows the relative performance1 of the S&P 500 versus 3-month T Bills after sell signals generated by several indicators including valuation (1972-2025). The holding period is short, only one-month, because in my experience, that is the easiest (or least difficult) time horizon to forecast with any degree of accuracy.

The last column shows that in any given month the risk of underperforming cash is just under 40% and the average month-on-month excess return generated by equities is 0.6%. These are the numbers that any half-decent sell indicator needs to beat.
Looking across the table we find that high/rising inflation provides the stiffest headwinds, with higher-than-normal probabilities of underperforming cash and steeply negative excess returns.
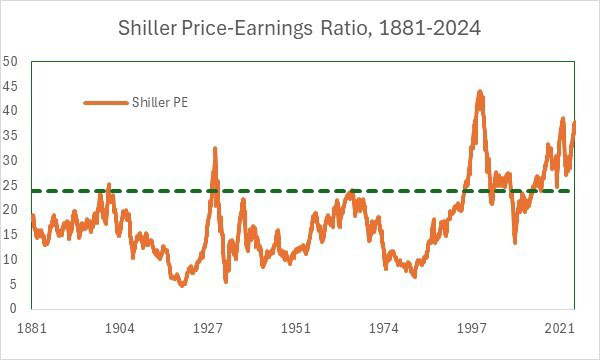
However, valuation aside, all the other indicators also do a pretty good job of identifying periods of low or negative excess returns. In contrast, a high Shiller PE (one of the better valuation metrics), has generated poorer returns than buy-and-hold (i.e. equity excess returns have been higher than normal during sell signals).
To be fair, these numbers are skewed by the current high level of US equity valuations and the stats for valuation may well improve in the years ahead. Furthermore, most analysts do not forecast just one month ahead (although maybe they should). On that basis, let us examine what happens when the holding period is increased to one year.

Even though most of the indicators have been built to forecast just one month ahead, they still do a reasonable job of identifying periods of sub-par returns. Indeed, the inflation indicators are almost as effective as they were over one month. The poor showing by the recession indicator is probably down to the tendency for equity markets to bottom during recessions. Note that even over this longer holding period, valuation only just manages to beat buy-and-hold.
In my view, the key takeaways are as follows:
- Apart from investors with truly long-term time horizons (e.g. pension funds and university endowments), valuation is of little help when it comes to top-down equity trading.
- Inflation is one of the most important variables.
- Momentum is a simple and effective way to add value, particularly over shorter holding periods.
- The best way to grow and protect capital is an approach that incorporates a broad range of disciplines, including sentiment and inter-market analysis.
1 Total returns, excluding trading costs, slippage and so forth.