Article 49
Jersey Property Revisited
In this article Westminster Asset Management Investment Strategist, Peter Lucas, follows up a previous article looking at the relative merits of Jersey Property as an investment.
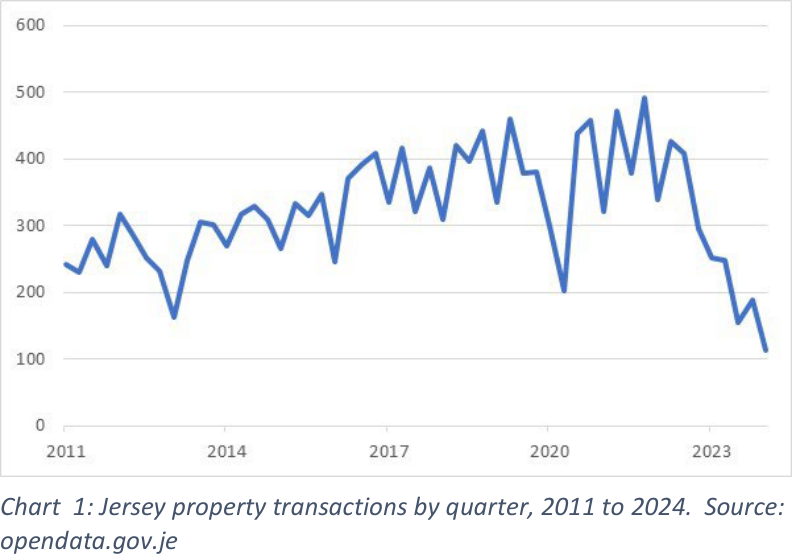
Fifteen months ago, I wrote an article explaining why I thought that financial assets would outperform Jersey residential property (“Confessions of an ex-landlord”, February 2023). Since then, property prices have fallen, and transactional activity collapsed due to higher mortgage rates and the introduction of a stamp duty surcharge on ‘second home’ purchases. In the meantime, although government bonds have struggled, equities and commodities have thrived in an environment of improving growth expectations and bottoming inflation. So, although it is very early in the game, it is one-nil to financial assets, which have the added benefit of being easier to value, and easier/cheaper to trade.
More recently, property prices have stabilized, and buyers have returned, leading some to declare that the worst is behind us, but I say not so fast. Although there are good reasons why the market might find its feet here, I remain pessimistic about the long run, at least in real terms.
In last year’s article I talked about the relationship between real interest rates (interest rates adjusted by the Jersey rate of inflation) and property valuations, i.e. the ratio of average property prices to average incomes. The lower the level of real interest rates, the bigger the incentive to borrow money to buy real assets. As we came out of COVID, inflation ‘surprised’ on the upside leading to a big drop in real interest rates and a last hurrah in property prices. In fact, the low in real rates did not come until late 2022, which corresponds almost exactly with the high in property prices. A similar, if slightly looser relationship between real interest rates and property valuations can be observed in the UK, where property prices also overshot as real interest rates dropped, as the Bank of England chose to keep interest rate low even as inflation soared.
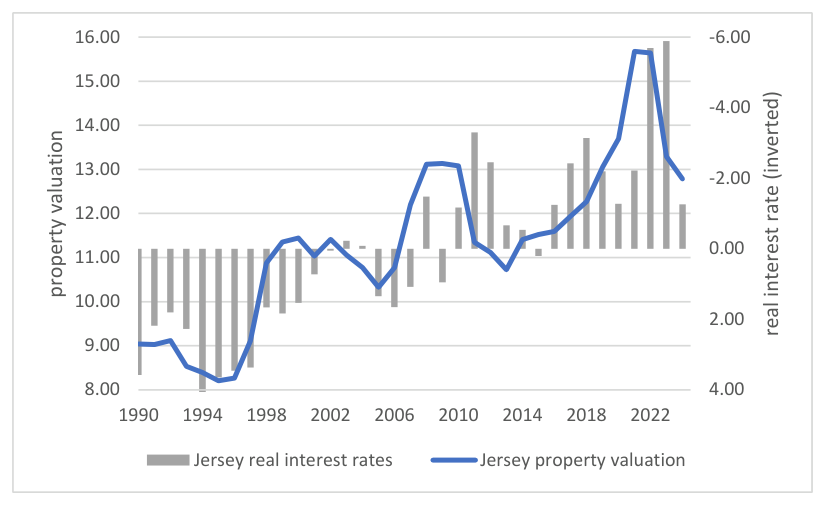
Chart 2: Jersey property valuation¹ versus real interest rates. Source: opendata.gov.je, Bloomberg, Westminster Asset Management
1 Based on average annual prices until 2002 and average quarterly prices thereafter
Chart 3 demonstrates the close correlation between real interest rates on the horizontal axis and valuations on the vertical axis, with low real interest rates associated with higher valuations and vice versa.
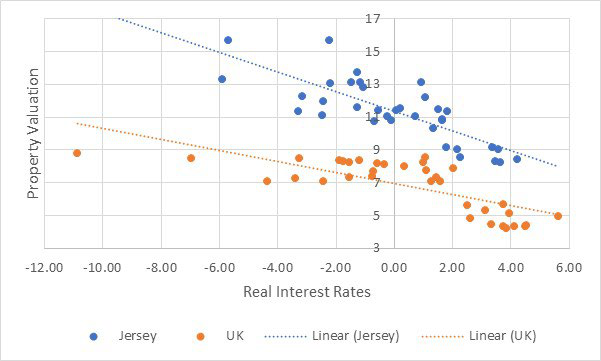
The chart also begs a question. Why is the Jersey line above the UK line? Or to put it another way, why does Jersey property trade on higher multiples than their EU equivalents? There may be others, but here are a few possible explanations:
• Calculation differences (i.e. RPI, average property
Chart 3: Property valuation versus real interest rates, 1990 - 2024.
prices, average earnings).
• Lower taxes in Jersey, i.e. higher after-tax incomes. • Greater inequality in Jersey (the Jersey Gini coefficient is 0.43 versus 0.35 in the UK) which means that the income gap of house buyers in the UK and Jersey might be wider than we observe at the aggregate level. • Sheer bull market complacency.
Although the state of the property market has been described as “dire,” it could be argued that the decline in Jersey/UK property prices has been relatively contained given the high level of valuations and the dramatic change in the interest rate environment. According to the UK Land Registry, property prices are only 3% below their 2022 peak. In Jersey the correction has been bigger (-9% on a seasonally adjusted basis), but prices have only fallen back to where they were just two years ago. Clearly, with so little transactional activity it is hard to know exactly where the market is, but for now let us take these numbers as gospel.
For a possible explanation for this ‘surprising’ resilience we must return to real interest rates. Although they have risen, real rates are now only just entering the low end of the range that prevailed from 1981 to 2008. Furthermore, incomes have increased by over 7%. A simple regression of (log) property prices on (log) incomes and real interest rates for the period 1990 to 2024, reveals that property prices could now be below ‘fair value.’
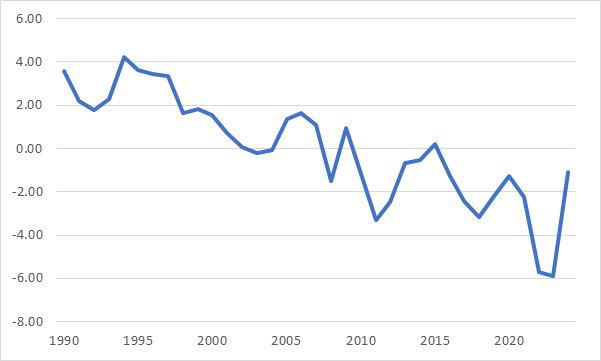
And there is more good news. Real UK interest rates have risen of late but given the sheer size of the national debt, the likelihood is that the Bank of England
Chart 4: Jersey Real Interest Rates². Source: Opendata.gov.je, Bloomberg, Westminster Asset Management.
will be reluctant to raise them much more, for fear of triggering a debt funding crisis. Indeed, there is every chance that they will follow the lead of Sweden and Switzerland in cutting rates in the months ahead.
² Average of UK Base Rate and 5-year gilt yield minus Jersey RPI inflation
Jersey inflation is now well below its peak but remains above UK levels, as it has done for most of the past forty years. Indeed, the Island now seems to be locked into something of an inflationary spiral of high costs, people leaving the island, labour shortages, and more cost rises. In short, reasonable valuations combined with rising incomes and stable/falling real interest rates, mean that the immediate outlook for Jersey property is neutral or even favourable.
However, the long-term prognosis is less positive. Jersey is now an expensive place to live and do business, and it is hard to believe that living costs can keep rising in this way without any negative consequences. At some stage local businesses will be forced to reduce costs via outsourcing and/or labour-saving technology leading to job losses. A shrinking population, rising unemployment and declining profitability will likely mean lower tax revenues, and in time, redundancies from the public sector. When the bubble bursts, the likelihood is that inflation will be lower – and real interest rates commensurately higher
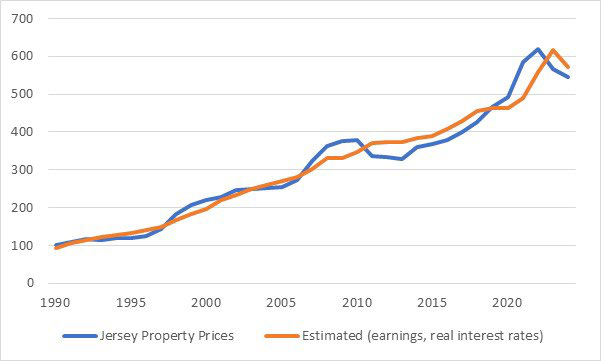
Chart 5: Jersey property prices, actual versus estimated³, Source:
- than the UK. In what will probably be an
Opendata.gov.je, Bloomberg, Westminster Asset Management.
environment of high global inflation and relatively low real interest rates, Jersey property prices may not fall in nominal terms, but it is hard to see how they will be able to rise in real terms (the property index is already down 20-30% in real terms since its peak) in that type of environment.
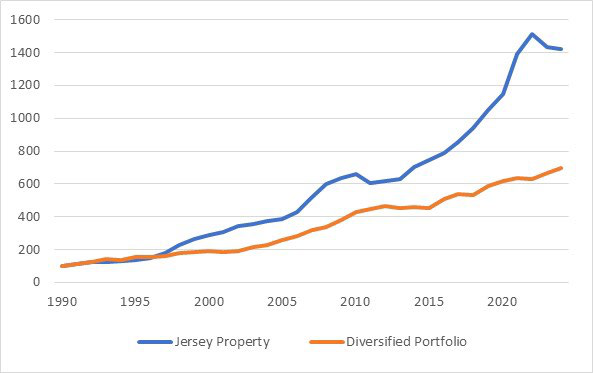
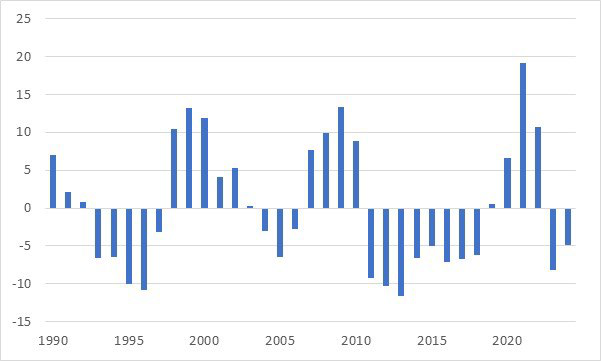
Chart 7: Jersey property⁴ versus Diversified Portfolio⁵. Source:
Chart 6: Divergence from “fair value”. Source: Opendata.gov.je,
Opendata.gov.je, Bloomberg, Westminster Asset Management.
Bloomberg, Westminster Asset Management.
When Spain and Italy joined the euro, they initially boomed supported by the lowest interest rates in generations. But eventually, rising consumer prices rendered them uncompetitive, and the boom turned to bust. In a similar way, Jersey is locked into a monetary union with the UK, with no control over its interest rates. In the past, rates have generally been too low for our needs and inflation has run out of control, but with our costs now well above UK
³ Estimated accounting for earning and real interest rates, ⁴ Assuming 3% income return, ⁵ 25% global equities, 25% global bonds, 25% gold, 25% cash (total return GBP terms) levels, one suspects that a bust phase is coming, at which point UK rates could well prove to be too high for our purposes.
This article has focused on the role played by interest rates and inflation in determining property prices in Jersey and elsewhere. It has highlighted the challenges that come with being in a single currency area with the UK, and how boom will eventually turn to bust. It has not considered the role played by government – in feeding the inflationary spiral and in making rental property a less attractive investment proposition – or high impact, low probability events like the demise of the finance industry, but these considerations merely serve to bolster the case against Jersey property. I remain steadfast in my belief that financial assets will be a better place to invest hard-earned savings in the years ahead.