Article 40
Clarity ahead
Following a period of mixed signals from economic data and the markets, Westminster Asset Management Investment Strategist Peter Lucas believes the much anticipated economic slowdown is imminent.
Understanding the past is the first step towards forecasting the future. For the past six months I have preferred bonds to equities on the basis that economies were either in recession or about to enter one. It turns out that I was unduly cautious. US equities have done no worse than flatline and other equity markets have done considerably better, leaving bonds in their wake.
What did I miss six months ago and later, in my year-end review? First, I should have noted that the consensus view on equities was already negative, particularly at the start of the year. The bar of expectation was low, which meant that good news would elicit an effusive reaction from the markets. Second, I should have recognised that even if a US recession is the end destination, the economy must pass through Goldilocks (lower inflation combined with low but positive economic growth) to get there. And markets like Goldilocks. That is essentially where we have been: inflation might still be uncomfortably high, but it is decelerating, and economic growth has held up, supported by households running down their COVID savings. Europe has had an extra dollop of good news in the shape of a collapse in gas prices (due to an unusually mild winter) combined with an end to China’s zero-COVID policy (Europe has stronger commercial links with China than America).
What was good news for European equities has been disastrous for bonds. In just six months the German 10-year Bund yield has gone from 0.8% to 2.5%, leading to a capital loss of around 14%. Gilts are some way off their worst levels but have experienced similar losses over the full period. US Treasuries have fared better but have still experienced double-digit losses. To be fair, most of the damage was done in 2022, with bonds largely moving sideways in 2023.
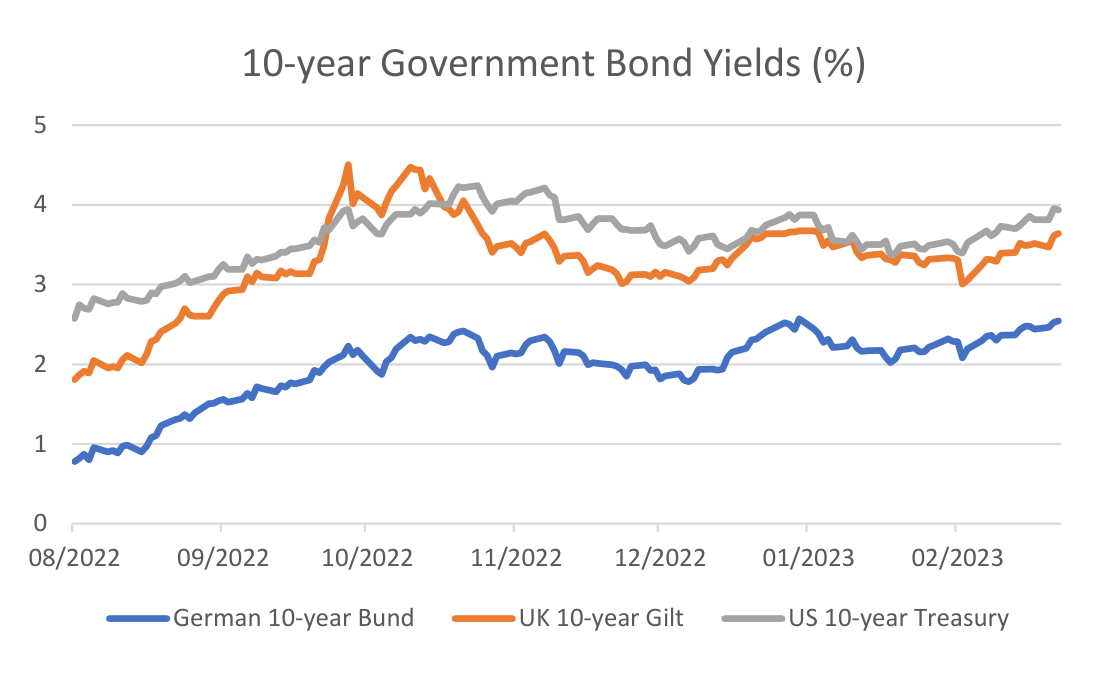
Source: Bloomberg
How do we square US leading indicators at recession levels with economic data that has recently exceeded expectations? Several explanations have been presented: (1) aggressive seasonal adjustments flattering the data (2) companies holding onto staff due to the difficulties that they had in recruiting them after COVID (3) a post-COVID rebalancing of the economy away from manufacturing to services, which is depressing the (normally reliable) manufacturing leading indicators. Note that if companies are retaining employees, resilient demand today will come at the cost of lower profits tomorrow.
The case for a US recession is still strong. The US yield curve, a reliable recession indicator, has inverted further. Detractors will tell you that inversions have provided false signals over the years and that besides, the bond market is now too manipulated to be of any real value as a forecasting tool. That may be so, but deep and persistent inversions do have a very good track record. An inversion of 0.3% between the 10-year and 3-month parts of the yield curve has successfully predicted all eight of the recessions since the late 1960’s with an average lead time of 9 months and no false signals. There have been just three inversions as big or bigger than the current one (close to 1%), and in those cases the lead time was just under four months. If recession is coming later this year, markets should start to reflect that any day now.
The property market remains a particular area of concern. There has been talk recently of some stabilisation in house prices, but with the National Association of Realtors’ affordability index at a three-decade low, it hard to see that lasting. And with property-related sectors accounting for as much as 18% of annual GDP (source: National Association of Homebuilders), any downturn will have a meaningful impact on overall growth. But what is bad for growth will be good for inflation. Owners’ equivalent rent inflation, which makes up over 30% of the CPI basket, follows property price inflation with a 12-16-month lag. Currently 7.8%, that should fall to 3% in the next twelve months.
It is remarkable that there has been very little capitulation selling out of Cathy Wood’s Ark Innovation ETF, a talisman of the 2016-21 technology/growth bubble, despite it being down 74% in the past two years. In fact, there are more shares outstanding today than at its peak. That suggests that the bear market has further to run. The first tech bust of the early 2000’s only ended when money rotated out of the NASDAQ 100 ETF (QQQ) into the S&P 500 equivalent (SPY), something we have yet to see in this tech bust. Furthermore, a comparison of the ARK price chart with the remarkably similar NASDAQ chart from 2000-02 suggests that the recent rally will be followed by another fall to new lows (the equivalent fall in the NASDAQ in 2002 saw the index half in the next ten months). This analogy is not something to bet the farm on, but it is certainly thought provoking, particularly given the broader macro picture.
In summary, there are reasons for thinking that the recent US economic data is a red herring and that we will see lower economic growth and lower inflation in the months ahead. US Treasuries should beat equities, particularly given that equity sentiment is now much more positive than at the start of the last two rallies in the S&P 500. With natural gas prices in Europe now below where they were at the start of the war, the likes of Europe and the UK are less likely to pull off the same decoupling act that we have seen in the past few months, so one should tread carefully there also. Japan may be a good alternative for investors looking for a safe-ish port in a storm. It is well placed to benefit from the China reopening/recovery story, the Nikkei has already underperformed other markets by 20-30% in the past two years, plus the yen is cheap and has a habit of performing well in and around US recessions.