Article 10
Investing for Inflation
With inflationary expectations rising our Investment Strategist Peter Lucas considers the impact of inflation on a variety of asset classes.
Inflation, or rather changes in the rate inflation is one of the key drivers of financial markets. And right now, opinion on that subject is arguably as divided as ever. Some believe that the current economic downturn will mean lots of spare capacity, which will keep inflation under wraps for some time to come. Others see an environment that looks increasingly like the inflationary 70’s: negative real interest rates, record money supply growth, loose fiscal policy, compromised free markets and central banks shifting their focus from inflation to employment. Furthermore, they remind us that the 70’s was a time in which high inflation was able to co-exist with high unemployment, in an environment that came to be known as stagflation. Whatever the merits of those two schools of thought (we subscribe to the latter), let’s presume that inflation is going to rise in the years ahead, what can history teach us about the likely market response?
Let’s start with some statistics. The chart and table below show the average calendar year real (after inflation) returns of various asset classes under different inflation environments since 1971. Clearly there are lots of other factors that affect performance (e.g. economic growth, interest rates and valuations), but nonetheless, some clear patterns emerge. Gold and commodities like rising inflation but government bonds like falling inflation. No big surprises there (although the big gains delivered by gold and commodities when inflation rises are something of an eye-opener). What might surprise you though is the poor performance of equities when inflation is rising. After all, aren’t equities supposed to be a good way to inflation-proof your portfolio?
| Change in inflation (%) -6 to -4 | -4 to -2 | -2 to 0 | 0 to +2 | +2 to +4 +4 to +6 | ||
| 10yr US Treasuries (%) | 14.41 | 9.75 | 4.68 | 3.32 | -9.48 | -8.34 |
| S&P 500 (%) | 23.91 | 10.36 | 15.38 | 4.74 | -4.11 | -9.14 |
| Gold (%) | -9.86 | -11.49 | 0.58 | 6.31 | 32.77 | 85.67 |
| Commodities (%) | -8.31 | -13.39 | -9.77 | 21.73 | 20.04 | 43.29 |
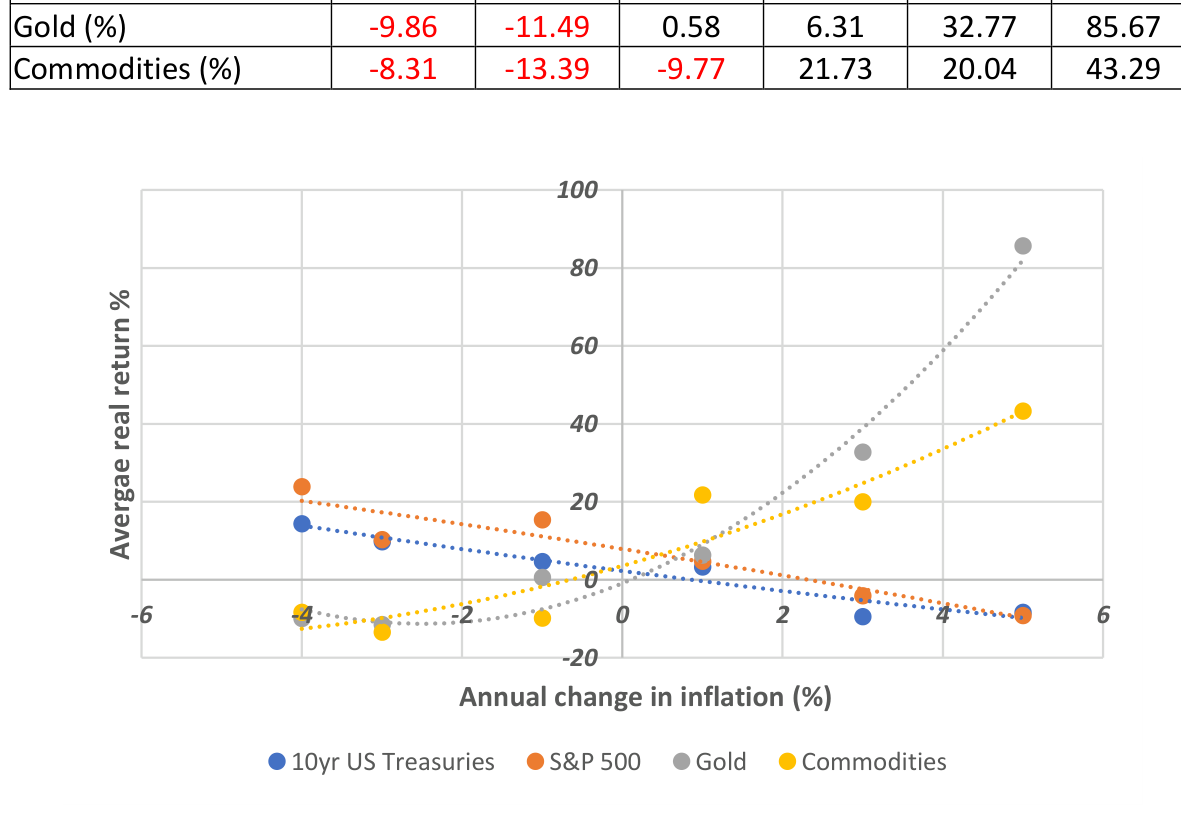
Dealing with that last point first, equities are indeed a good way to inflation-proof your portfolio in the long run. No other mainstream asset has a better track record of producing inflation-plus returns for holding periods of ten years or more. However, that is a very different concept to protecting your portfolio against accelerating inflation.
The chart below shows a popular valuation measure, the Shiller P/E against inflation in America since 1881. Commentators often talk about the Goldilocks economy being good for equities (“not too hot, not too cold, but just right”) and this chart goes some way to explaining why that is. The highest stock market ratings tend to happen when inflation is low and stable in the 0-3% range. Equities ratings tend to be lower when inflation is above or below that range.
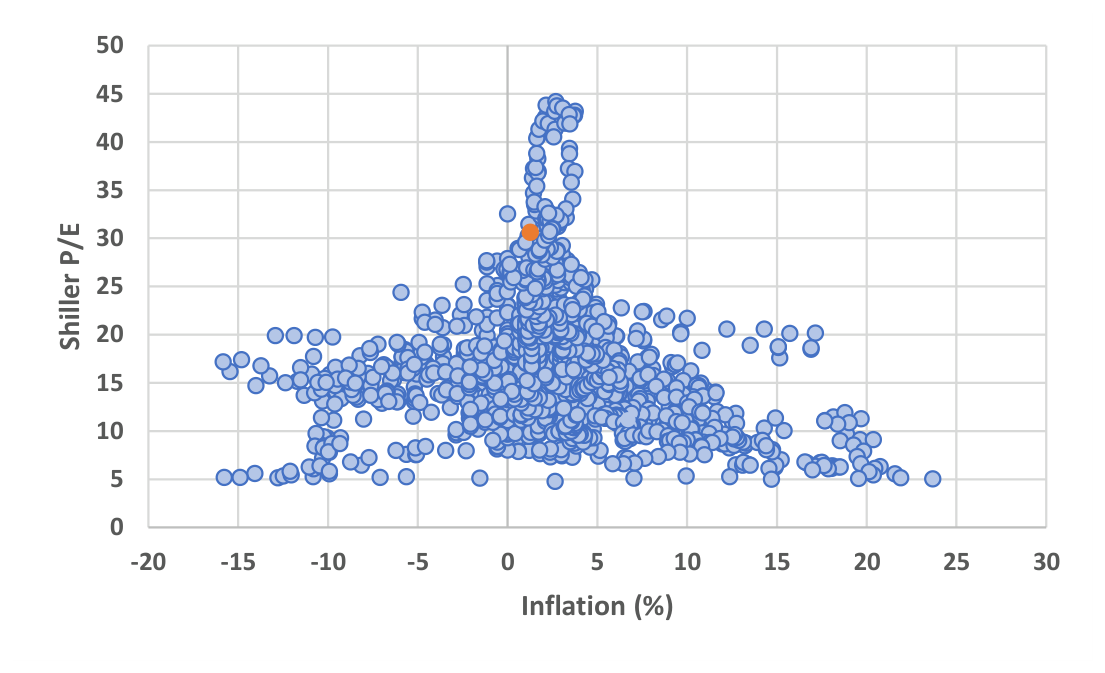
The chart also explains why equities perform poorly when inflation is accelerating. The S&P 500 is currently trading on a Shiller P/E of 30 (the orange dot on the chart) – a high rating certainly, but one that is not totally inconsistent with history. However, if inflation were to rise (shift to the right on the chart) the scatter graph suggests that the market rating would fall. For instance, the highest rating there has been with inflation at 6% has been around 22, which would imply a fall in the market of 27%, assuming no change in earnings. With inflation at 6%, that would translate into a negative real return of over 30%.
A negative number of that magnitude may appear to be slightly at odds with the first chart which shows a 4-6% rise in inflation being associated, on average, with a real return of -9%. Again, the second chart explains why that might be. The first chart shows the average performance of the S&P 500 against changes in inflation, irrespective of the starting point. But clearly if the starting point is deflation (i.e. inflation below zero) then rising inflation would be good news because it takes the market back into the ‘sweet spot’. This can be demonstrated by calculating the average market return under different inflation environments.
| Inflation starting point | above 4% | above 4% | Below 4% | Below 4% |
|---|---|---|---|---|
| Inflation direction | falling | rising | falling | rising |
| Average annual return (%) | 16.74 | -6.66 | 12.15 | 6.89 |
In summary, if inflation rises in a meaningful way, it will be bad news for the traditional bond/equity portfolio, which would be expected to generate negative real returns whilst inflation is trending higher. These losses can be mitigated through investment in assets that thrive in a rising inflation environment. This article has demonstrated the positive inflation credentials of gold and other commodities, but consideration could also be given to other assets like the shares of commodity producing companies, infrastructure and inflation linked bonds.
How does this all relate to the current situation? Inflation is currently very low and stable, just the way that equities and bonds tend to like it. But if inflation starts to rise, bonds will take it on the chin straight away, particularly given the very low prevailing level of yields. As is now hopefully clear, the story for equities is more nuanced. Looking at the table above, we are currently transitioning from column 3 to column 4, which is not exactly disastrous. However, if inflation breaks above 4% (unlikely in the immediate future) then the outlook for equities will darken considerably.